
To identify drivers of NFIP insolvency failure and debt we first use inflation-adjusted, annualized claims to identify regions of expected net loss under current risk based-premiums (Methods, Section “Federal Flood Insurance and Precipitation Data”), paired with qualitative synthesis (Methods, Section “Qualitative Synthesis”) and simple normal-form games to illustrate motivations for internal conflict in the current system. Next, we employ unsupervised spatiotemporal clustering (Methods, Section “Spatiotemporal Clustering”) on loss data to identify and evaluate hotspots (Methods, Section “Hotspot Analysis”) of spatiotemporal clustered losses and chronic, repeated losses. We performed interviews with stakeholders across the reinsurance industry to inform our approach to analysis. Stakeholder conversations about recent insurance failures and natural hazard risks informed our approach to aggregate risk assessments. Additionally, concerns raised about regions of high risk, recurrent failures, and catastrophic events with highly correlated losses became themes in informal interviews that allowed us to hone our approach to analysis.
We identify “hyperclusters” as extreme instances of clustered spatiotemporal damage, defined using two metrics—(i) a spatiotemporal contiguous loss exceeding $1 billion, and (ii) a threshold approach for the sum of inflation-adjusted claim damage cost exceeding 99.9% of clusters in total damage claims in line with assessment of previous disaster damage assessments and threshold-based risk communication7,51,52. Additionally, we consider the frequency of presidential disaster declarations as an indicator of hypercluster risk, specifically performing Getis-Ord hotspot analysis on the number of total declarations by county nationally over the historical record. We define risk of unclustered, recurrent claims by (i) the count of properties by county that have made multiple claim filings historically through the NFIP, (ii) the count of claims by county that are not associated with spatiotemporal contiguous losses in unsupervised cluster analysis. Finally, we summarize findings with an aggregate risk index for flood insurance insolvency nationally using indicators of (1) net expected loss, (2) hyperclustering, and (3) recurrent loss. To do so, we employ combinatorial game theory across objective entropy-based weightings and expert-informed subjective weightings (Methods, Section “Game Theoretic Risk Aggregation”). We note that our approach to assessment is limited due to data availability. Due to the unavailability of public household-level premium data linked to historical NFIP claims and the change in insured assets over time, we are limited in our normalization approach to historical claims, only adjusted for inflation. A summary of our risk assessment framework is depicted in Fig. 1.
Methodological framework from data inputs to aggregate insurance insolvency risk, constructed in Microsoft Powerpoint.
Given recent federal action to move onus for emergency management to state and regional governments, including proposals to dissolve FEMA12, it is important to consider the self-sufficiency of state and regional governments to self-insure against expected losses. In the homeowner’s insurance market, withdrawals of private insurers from national pools in given states such as Florida and California have led to increasing prevalence of reliance on last-resort insurance pools at the state level50,53. If the federal market dominance in US flood insurance decreases, we may expect regional risk profiles becoming increasingly relevant for payment and insurance solvency. The drivers of the historical accumulation of NFIP debt are particularly poignant in this regard8,9. This led to our focus on the disaggregated risks for local insurance pools, as well as potential net beneficiaries and contributors to loss at the national scale in a system dominated by state or local insurance markets. The disaggregated retrospective analysis provides insights into the questions that emerge under this scenario.
Expected net losses under risk-based premiums
A clear symptom of regional insurance pricing failure is when a region’s expected losses cannot be recovered by premium cost over time, leading to local insolvency. Although typically insurers have a portfolio to buffer regional risk, premiums are ideally priced to recover such expected losses. Motivated by repeated historical programmatic insolvency in the NFIP, Risk Rating 2.0 (RR2) was implemented by FEMA in 2023 to update NFIP premium rates to be more reflective of property flood risk19. Here, we use current 2024 risk-based premium rates under RR2 (in lieu of historic, underpriced premiums) to consider expected regional losses under current flood risk-rating practices (see Methods, Section “Federal Flood Insurance and Precipitation Data” for data descriptions). With the current risk-based premiums and historic annualized, inflation-adjusted claims aggregated by county, we evaluate the extent to which prior claims can be recovered by current risk-based rates.
Under the new heightened premium scheme, historic expected failures outweigh premiums in aggregate for many counties (Fig. 2). Current RR2 premiums are able to recover historic losses, representing a sum that amounts to over four times that of historic premiums. However, by region, the ability of RR2 premium rates to recover historical claims varies. Counties with expected net loss are largely within the Mississippi River Basin (panel a). Hotspot analysis (see Methods, Section “Hotspot Analysis”) shows significant expected losses in major coastal cities in the South along the coasts of Texas, Louisiana, Mississippi, and Alabama, as well in the Northeast in New Jersey and New York (panel b). Surprisingly, aggregate risk-based premiums largely recover claim costs in Florida and other counties along the East Coast that may have been expected to be insolvent. This is likely driven by high insurance uptake and increased risk-based premiums, particularly in Florida. A similar dynamic emerges in California, where uptake and premium cost outweigh expected claims. Socio-economic demographics of counties with an expected insurance loss are reported in the SI, Section 2, Fig. S1.
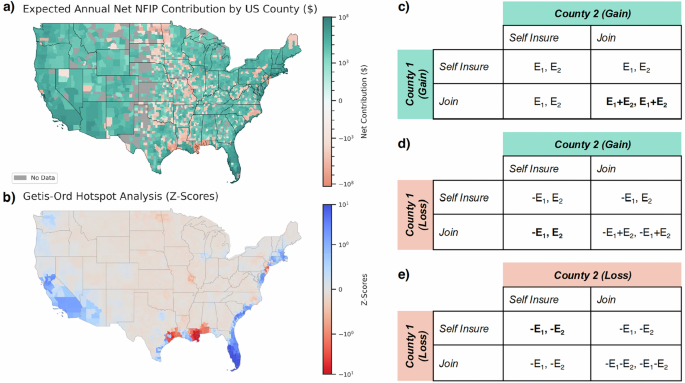
NFIP expected net contributions (a) and hotspot analysis (b) under 2024 Risk Rating 2.0 premiums and claims history spanning 1978 to 2024. Colors are displayed on a logarithmic scale as shown in color bars. Expected claims are aggregated by region and annualized, divided by the number of years on record per region. Premiums are aggregated by region and taken directly from 2024 reported Risk Rating 2.0 premium rates. Hotspots are extracted using the Getis-Ord statistic (see Methods, Section “Hotspot Analysis”), and Z-Scores for all counties are displayed in panel b. All prior claims are CPI-adjusted based upon the federal urban CPI Index provided by the US Bureau of Labor Statistics. Illustrative normal-form games of competitive dynamics between countries operating under expected loss and gain are shown in (c–e). Nash equilibria are bolded.
Considering internal system dynamics, we can also conceptualize counties with expected gains as subsidizing those with expected losses. We illustrate these unstable regional competitive dynamics caused by disproportionate expected losses within the NFIP with a series of two-player normal-form games (Fig. 2c–e). Consider insurance as a pool of collective buy-in, in which a given community pays a nominal annual fee (premium) reflecting their risk, so that in the case of a low-probability hazard, the community is able to withdraw funds (claims) from the common pool. We consider a game between two players which are represented by two different counties, each with an expected annual contribution to the insurance pool, \({E}_{1}\) and \({E}_{2}\), respectively. Each county can choose to “self-insure” in which they keep their own regional insurance pool for their community, or to “join” in which they merge insurance pools with their opponent. Pools are only joined if both players can agree. It is in the best interest of each regional player (in our case a given county) to diversify their portfolio of risk to expand the available pool of resources (panel c). Nash Equilibrium is a game theoretic solution concept which denotes a ‘stable outcome’ in which no player can gain by unilaterally changing their strategy, given the strategies of others54. Thus, in the case in which each county has an expected gain, we reach Nash stability under cooperation, where both players join. However, it is not in the best interest of a regional player to do so if their opponent is expected to withdraw more funds than reflected in their annual premium payments (Panels d and e). Using game theory, we illustrate that under the current NFIP risk-based prices, competitive unstable dynamics emerge between counties due to regional expected losses within the general pool (panel d).
A primary motivation of such game theoretic analysis is to examine regional debt contributors and beneficiaries of the current national pool, in order to interrogate the self-sufficiency of non-pooled insurance. If the NFIP were to be moved to state pools, which is plausible under calls to dissolve FEMA and drastically reform the NFIP9,12, the solvency of local pools becomes much more regionally relevant. We note that natural disaster insurance more generally aims to facilitate societal risk buffering through both space and time, such that a disaster-struck region receives subsidy from aggregate accumulated premium balance both from unaffected regions at such time, and from their own accumulated pool of premium from time periods without damaging floods. Here, we aim to interrogate the stability of local pools by eliminating the spatial buffering. Specifically, we look at the ability of regional pools to self-insure under their current risk-based pricing. This not only highlights net beneficiaries of the current system, but also highlights vulnerable regions to the disaggregation of risks in the case of non-federally pooled flood insurance.
Spatiotemporal hyperclustering
Although expected losses reflect loss recovery regionally, the analysis begs the question whether hotspots for failures are driven by recurrent patterns of mispriced risk, or singular catastrophic events that induce massive unrecoverable losses26. In order to identify spatially and temporally correlated losses and extreme catastrophic events, we use unsupervised machine learning to identify spatiotemporally clustered (see Methods, Section “Spatiotemporal Clustering” for clustering details) insurance claims (Fig. 3a). “Hyperclustered” dynamics emerge from our clustering analysis: although over 90% of claims belong to spatiotemporal clusters, the top eight clusters by total cost outweigh the sum of all other historic claims (panel c). Hyperclusters are largely found in the South and Northeast, driven largely by hurricanes: ten out of the twelve billion-dollar clustered events being hurricane-induced (panel b). In examining the empirical distribution of clusters by the total sum of claims, we find the billion-dollar event threshold to be in the 99.83% of clusters in terms of total damage claim cost, and report a 99.9% threshold of $2.38 billion for the claim sum by cluster. Between 1978 and 2024, twelve clustered events exceeded the billion-dollar threshold (panel b). Of the billion-dollar events, eight events exceed the 99.9% threshold and four of these events (Hurricane Katrina, Hurricane Sandy, Hurricane Harvey, and Hurricane Ian) exhibit loss totals that exceed the total of 2024 risk-based premiums in aggregate across the entire country (panel d). This shows the extent to which these hyperclustered events are largely uninsurable under standard price recovery models, the top four events independently overwhelming a risk-priced insurance system (panel d).
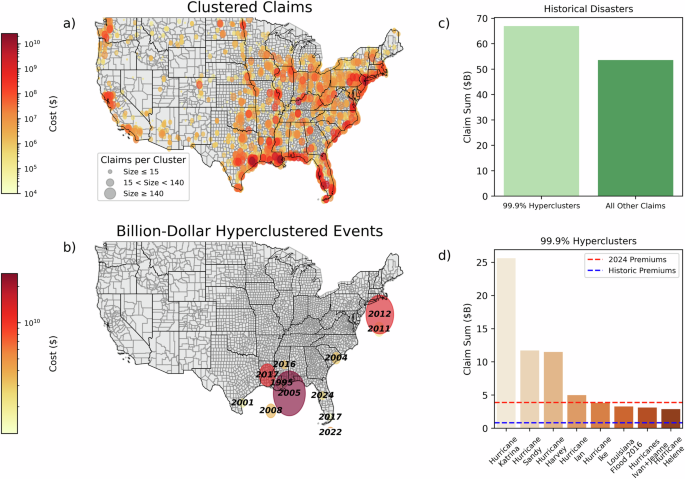
Spatial distribution of clustered and “hyperclustered” flood-inducing events across all clusters (a) and billion-dollar clusters (b). c Shows the cumulative claim sum of all 99.9% clusters by dollar value in comparison to the sum of all other historical claims. d Depicts the 99.9% clusters by their dollar value. Spatiotemporal clusters are extracted using ST-DBSCAN (see Methods, Section “Spatiotemporal Clustering”) under thresholding parameters: a space threshold of three degrees latitude/longitude, time threshold of five days, and a minimum cluster size of seven. A cluster size of 15 falls at the 50th percentile of cluster size, and 140 claims at the 90th percentile, denoting size cutoffs for panel a. Parameters for clustering are optimized under validation, and sensitivity is detailed in the SI, Section 4. All claims are inflation adjusted to 2024 using urban CPI values provided by the US Bureau of Labor Statistics.
The impacts of hyperclustered events are challenging to recover under standard price recovery models, resulting in debt accumulation if premium pools have not accrued sufficient value. If the climate were stationary, and the risk pool were large enough, this would not be a problem since insurance seeks to equalize the premiums with the expected value of the draws. However, where quasi-periodic or secular trends and event clustering over inter-annual and decadal periods is evident27,28,29,55, the likelihood of a run of catastrophic draws that bankrupts the insurance system becomes problematic, unless there is a large reserve or backup facility. Of course, reinsurance is one of the mechanisms that is employed to cover these cash flow situations, and a national program like NFIP does have recourse to legislative action to bail it out. What we observe is that the deficits persist despite the availability of those mechanisms, and are driven in large part by the inability to cover the catastrophic event sequences.
We also examine temporal dynamics of insolvency. Specifically, we use 2024 risk-based premiums and examine temporal variation in the countywide net expected annual balance, using the historical record of inflation-adjusted filed claims. We evaluate when chronic insolvency occurs under historic annual clustering with and without hyperclustering. In Fig. 4, we show that the top five hyperclusters cause billions of dollars in expected debt for the program (panel a). However, if we remove hyperclusters (under both the 99.9% and the billion-dollar definitions) (panel b), the balance of the program is able to recover claims losses. Results indicate that while the system cannot recover the history of annual claims with current risk-based premiums, hyperclusters are largely driving failure. Without the eight 99.9% hyperclusters, the program is able to recover claims across the history of annual claims with risk-based premiums, and without the billion-dollar hyperclusters, the program recovers claims while gaining over $1B in premiums each year. This is essential for covering salaries, operations, and the continuous management of the program. We note that eleven out of twelve billion-dollar hyperclustered events and all eight 99.9% events occurred in the 21st century, potentially indicating the influence of climate change56, population growth in floodplains57, and/or deterioration of infrastructure58 on damaging floods in recent years. We find that in the absence of hyperclustering of insured assets, insolvency and NFIP debt becomes much less probable under current risk-based premiums.
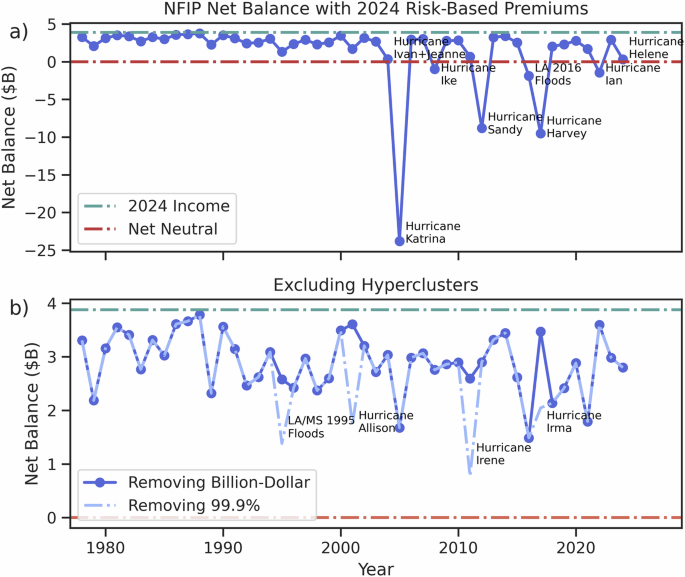
Time series of temporal points of insolvency under 2024 risk-based premiums and historical annual losses, inflation-adjusted (using CPI-U) from 1978 to 2024. Panel a highlights the historic time series while (b) removes 99.9% hyperclusters (labeled as failure points in a) and billion-dollar hyperclusters (labeled in b).
Note that in our analysis in Fig. 4, we neglect the temporal accumulation of premium resources. The objective of this analysis is to compare the previous claims history and the FEMA’s current risk-based scheme’s coverage (RR2) each year. As historical NFIP premiums have been underpriced1,20, the recent RR2 premiums aim to close the gap that historic coverage failed to provide19. We aim to evaluate how much of said gap has been closed, using the most recent data provided by FEMA on new RR2 premiums. This approach is limited as it neglects trends and the likely nonstationary changes in future losses51,59, but allows us to consider which loss years may result in system fragility, considering the lack of fund accumulation within the current NFIP into the near future. Considering Executive and Legislative concerns around debt accumulation within the program, near term impacts are of large relevance8,12.
As indicators of regional failure, we perform a hotspot analysis (see Methods, Section “Hotspot Analysis”) to identify regions prone to hyperclustering. In Fig. 5, we examine counties directly implicated by hyperclustered events (panel b) as well as counties implicated by flood-related Presidential Disaster declarations (see SI, Section 3, Table S2 for categorization) scaled by aid disbursements (panel a). Precipitation data is used to gain insight into the hydrometeorological severity of claim damage clusters and unclustered claims, but not used in the clustering process itself. A more comprehensive overview of such damage-associated precipitation analysis is found in ref. 28. Historically significant hotspots for hyperclustering are largely found on the coasts of Texas, Louisiana, Alabama, Mississippi, New Jersey and New York, with some risk highlighted along the coast of North Carolina and Southern Florida. Disaster declaration hotspots (panel a) indicate a higher risk in Florida and the Great Lakes region than those displayed in historic hyperclustered events (panel b). We find that the mean billion-dollar hypercluster exhibits a claim sum of nearly $6B in comparison to a mean cluster loss of $17 M (panel c). We also find significantly higher mean precipitation return periods associated with hyperclusters than all claims (panel d), indicating a higher event intensity for these events.
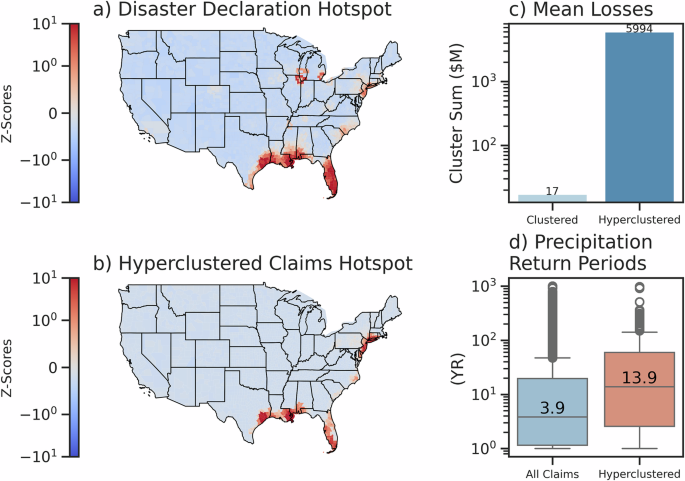
Getis-ord hotspot analysis (see Methods, Section “Hotspot Analysis”) for flood-related disaster declarations and hyperclustered events by county across the contiguous United States (a, b). Mean losses by hypercluster and cluster by inflation-adjusted cluster sum (under CPI-U) are compared (c) as well as the difference in mean precipitation return period between all claims and hyperclustered events. Precipitation return periods reflect the preceding daily maximum event within 30 days of loss using MSWEP county-level aggregated values from ref. 28 and detailed further in Methods, Section “Federal Flood Insurance and Precipitation Data”.
Recurrent, unclustered losses
Another major pain point for insurance failure identified by stakeholders (see SI, Section 1) was high-risk properties experiencing repeated, low-intensity failures due to being located in risky areas. Unclustered, recurrent risk is characterized by losses that are not found to be associated with nearby spatiotemporal damage clusters, yet exhibit repeated loss on an annual basis (Fig. 6). We analyze unclustered claims (panel a) as well as a database of multiple-loss properties from FEMA (panel b). As the claim amounts and dates of loss for multiple loss properties are not available publicly, a thorough analysis of the contributions of repeat failures to insolvency risk is limited. However, we use both the multiple loss property counts and valuations of unclustered losses as indicative of recurrent failures. A more detailed breakdown of multiple loss properties with current publicly available data is provided in the SI, Section 6, Fig. S3.
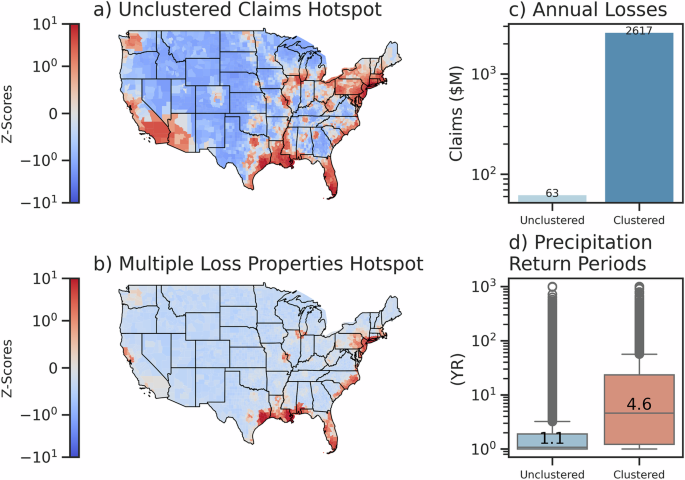
Getis-ord hotspot analysis (see Methods, Section “Hotspot Analysis”) for unclustered insurance claims and multiple-loss properties by county across the contiguous United States (a, b). Annual mean losses for claims that are clustered and unclustered (under CPI-U) are compared (c) as well as the difference in mean precipitation return period between clustered and unclustered losses. Precipitation return periods reflect the preceding daily maximum event within 30 days of loss using MSWEP county-level aggregated values from28 and detailed further in Methods, Section “Federal Flood Insurance and Precipitation Data”.
Similar regions of risk emerge across both datasets in southern and east coastal regions, as well as major cities such as Los Angeles, San Francisco, Chicago, and St. Louis, which likely all have higher populations of risky waterfront properties (panel b). Unclustered claims lead to an average of $63 M in losses annually (panel c). As anticipated, unclustered claims have nearly annual return periods for precipitation, indicating that very frequent events drive losses (panel d) in these settings. Across all years, unclustered losses amount to over $2B in damages. Although these losses are not solely driving the system insolvency, they are a pain point for continuous losses that is adding additional stress to the system for properties that are likely largely placed in highly risky regions, raising the question of whether these areas should be receiving continuous payouts or being relocated.
Summary and aggregate insolvency risk index
We summarize our findings by creating a novel aggregate risk index for insurance insolvency based upon metrics identified across qualitative and quantitative analysis (Fig. 7). We integrate findings from expert-informed qualitative synthesis with analytically-derived objective weighting criteria using the subjective-objective combinatorial game theoretic weighting approach first introduced by Lai et al.60. Subjective weights are discovered through qualitatively-informed ranking (see Methods, Section “Qualitative Synthesis”) followed by the Analytic Hierarchical Process (AHP), and objective weights are derived from each spatial dataset with Entropy-based Weighting (EW) as detailed in Methods, Section “Game Theoretic Risk Aggregation”. The two sets of weights are then aggregated with combinatorial game theory (detailed further in Methods, Section “Game Theoretic Risk Aggregation”). Our aggregate index includes metrics of (1) county-level expected net losses (Fig. 2), (2) hyperclustering risk (Fig. 5, panel b), (3) flood-related Presidential disaster risk (Fig. 5, panel a), (4) concentration of multiple-loss properties (Fig. 6, panel b), and (5) concentration of unclustered claims (Fig. 6, panel a). We provide subjective weighting criteria, objective weighting, and combinatorial weighting based upon game theory in the SI, Section 5. We find the highest levels of aggregate risk in dense metropolitan areas at risk of hurricane impact, specifically Houston, Texas, New Orleans, Louisiana, and New York City (panel a) where asset value density is high. Heightened levels of risk are identified along the coast of Louisiana, Mississippi, Alabama, South Florida, North Carolina, New Jersey and New York, as well as along the Mississippi River (panel b). Aggregate risk analysis suggests these regions are in need of additional funding mechanisms that are regionally accrued in order to mitigate their inordinate levels of flood risk. We underscore that for policy analysis, each indicator metric and the combined index are valuable, since from a policy action perspective, it is important to understand the type and magnitude of the risk, as well as the collective risk across types.
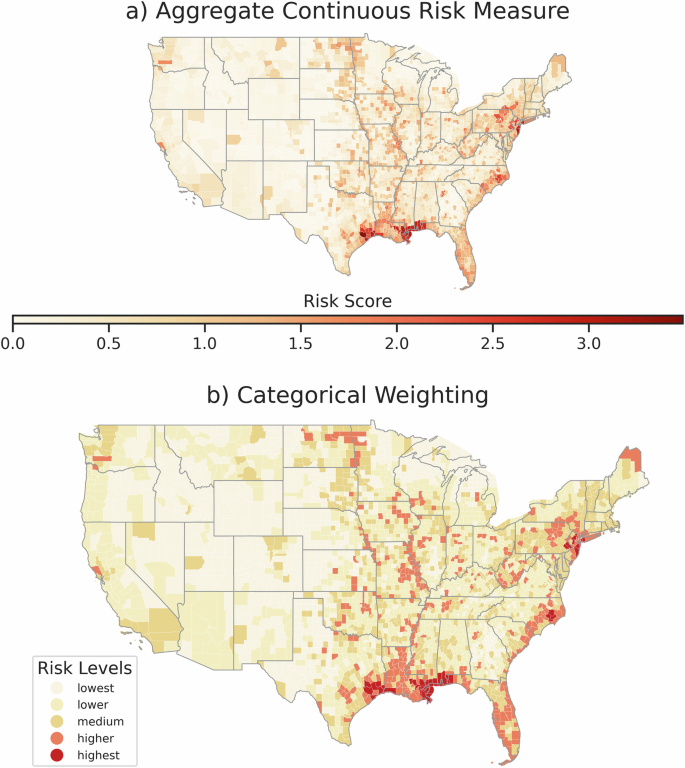
Aggregated flood insurance insolvency risk index developed using combinatorial game theory between subjective weighting with the analytic hierarchical process (AHP), and objective weighting with the entropy weighting (EW) method. Index aggregates (1) expected net loss by county under Risk Rating 2.0, (2) historic hyperclustering concentration, (3) historic flood-related presidential disaster aid concentration, (4) multiple loss property concentration, and (5) unclustered claim concentration. Results are presented in continuous risk scores (a) following60 and discrete binned categories (b) using k-means clustering.
In summary, we find that NFIP insolvency failure and debt accumulation are largely driven by catastrophic hyperclustering that is not accounted for in the design of the current risk-based premium schemes. In addition, we identify critical regions prone to recurrent failure that are in need of urgent systemic intervention. A summary of major findings is provided:
1.
Under inflation-adjusted, annualized losses and current risk-based premiums, there are significant coastal hotspots of expected net loss in the NFIP across the South in Texas, Louisiana, Mississippi, and Alabama, and the Northeast along New York and New Jersey.
2.
Hyperclusters account for the majority of flood insurance claims: the top eight events by damage cost account for over 50% of all historic insurance payouts. Without insured hyperclustering, insolvency and NFIP debt becomes much less probable under current risk-based premiums.
3.
Recurrent losses occur with precipitation events with low intensity relative to regional climatology and an expected annual frequency, losing the NFIP on average $63 M annually and a sum of $2.38B in total.
4.
In aggregate, we find regions most at risk are large, densely populated metropolitan areas with hurricane risk and coastal regions in the South and Northeast.
Our analysis suggests that NFIP insolvency is driven largely by catastrophic hyperclustering that is not accounted for in the design of the current risk-based premium schemes. In addition, regions with very frequent, recurrent claims that are not always spatially congruent contribute to the NFIP insolvency, and need to be addressed. Our work provides motivation for system intervention under catastrophic hyperclustered conditions and recommends managed retreat for properties exhibiting recurrent losses.
